Video Director
Scene-by-scene plan
The reference is a 31-second “SaaS Product Promo” template (After Effects, 1920×1080). Below is every scene, what moves, and what Raintree content goes in its place.
0:00–0:04
Intro + platform
Who we are
0:04–0:10
Clinical Documentation
3 scenes
0:10–0:14
Intelligent Scheduling
2 scenes
0:14–0:31
Revenue Cycle → close
Collage, recap, logo
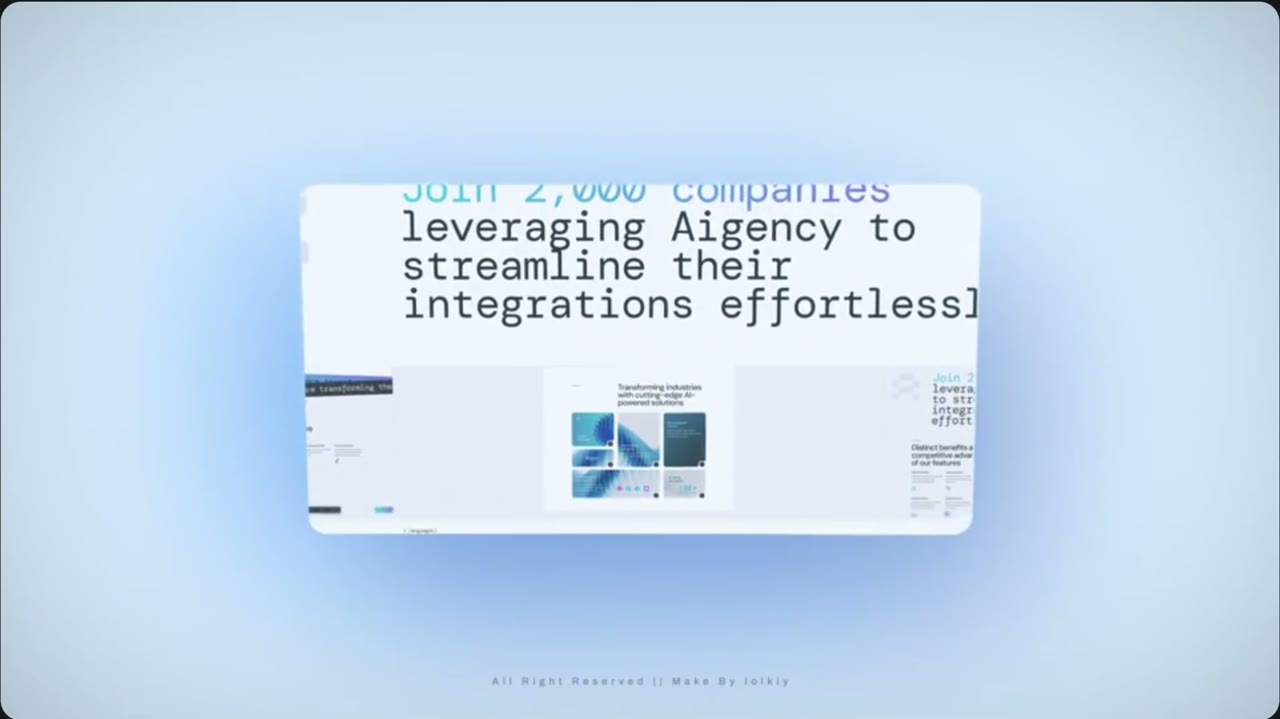
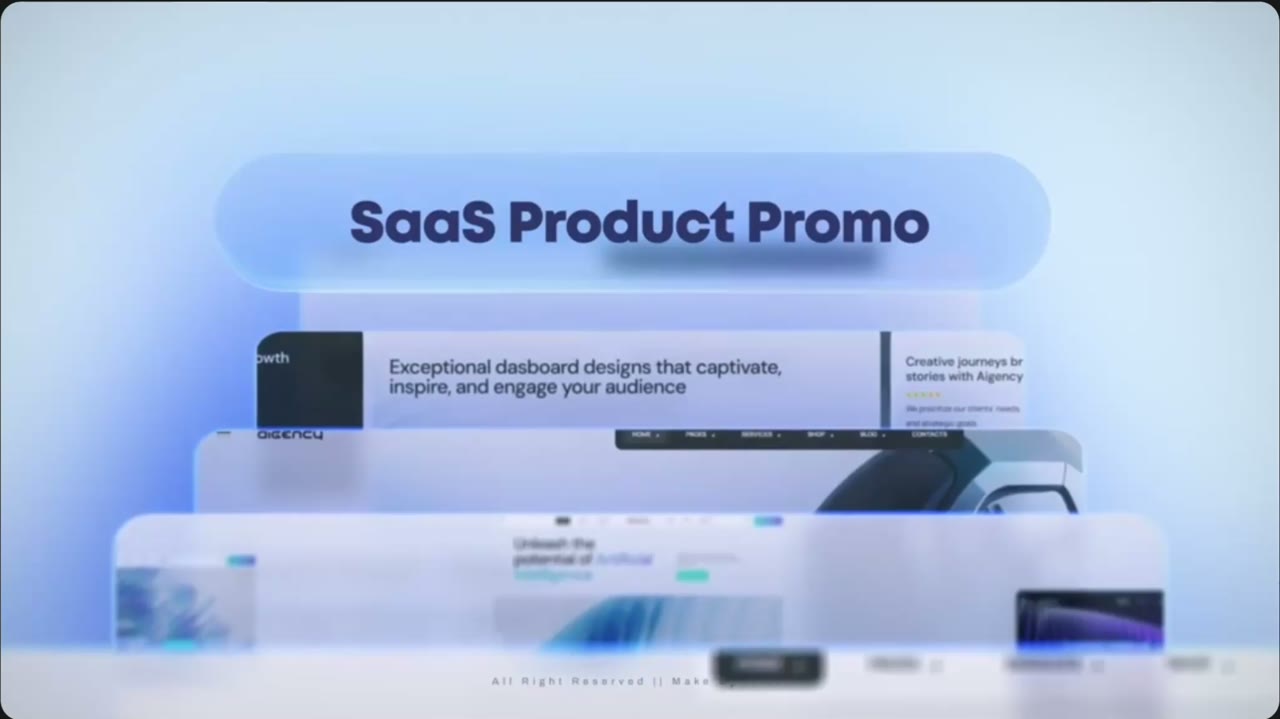 Scene 10:00–0:02Intro
Title over stacked screens
- In the reference
- Frosted pill reading “SaaS Product Promo” floats above a stack of website screens; a headphones photo sits in the back.
- Motion
- Slow push-in. Screens slide up from below, one behind the other.
- Copy
- Pill: Meet us at Booth 506.
- Back screen line: Raintree runs on innovation.
- Show first
- Clinical Documentation screen on top of the stack, Scheduling in the middle, Revenue at the back — the same order as the Booth 506 email.
Product UI to make
Stack card · Clinical Documentation · 1600×900
Script: White card, 16px corners, soft shadow. Header “Clinical Documentation” with sparkle icon and a “Live analysis” tag. Left: Note Completion ring (Subjective, Objective, Assessment, Plan). Right: Note Quality gauge reading 85, “Excellent” pill. Lexend. No patient names.
Stack card · Intelligent Scheduling · 1600×900
Script: Week schedule grid, one highlighted 9:00–9:30 AM appointment, orange “Fill opening” button, footer “Provider utilization 92%”.
Stack card · Revenue Cycle Automation · 1600×900
Script: Blue header “Revenue Cycle Dashboard”, “Automation on” tag, six claim rows, navy footer “Payer calls automated 1,284”.
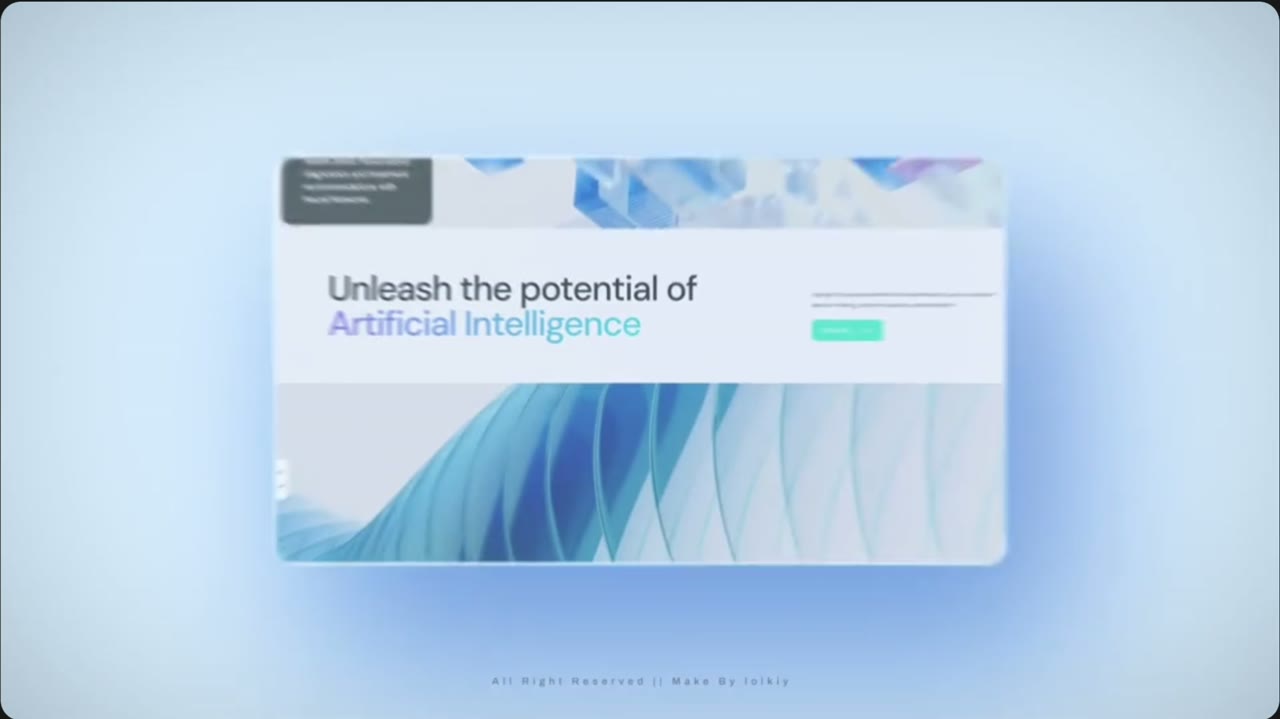 Scene 20:02–0:04Platform
Hero screen
- In the reference
- Single website hero: “Unleash the potential of Artificial Intelligence,” wave artwork, logo row underneath.
- Motion
- Screen settles flat in the center, slight scale-up, then blurs out.
- Copy
- Headline: Run on innovation.
- Second line (orange): Less busywork. More time for patients.
- Button: Visit Booth 506
- Show first
- One System graphic (care, operations, revenue) in place of the wave art. Remove the logo row.
Product UI to make
Hero · One System · 1920×1080
Script: Navy-to-white hero. Left: headline and orange button. Right: the existing One System graphic (from Product UI Creator → Platform) at large size. Bottom row: three small labels — Clinical Documentation · Intelligent Scheduling · Revenue Cycle Automation.
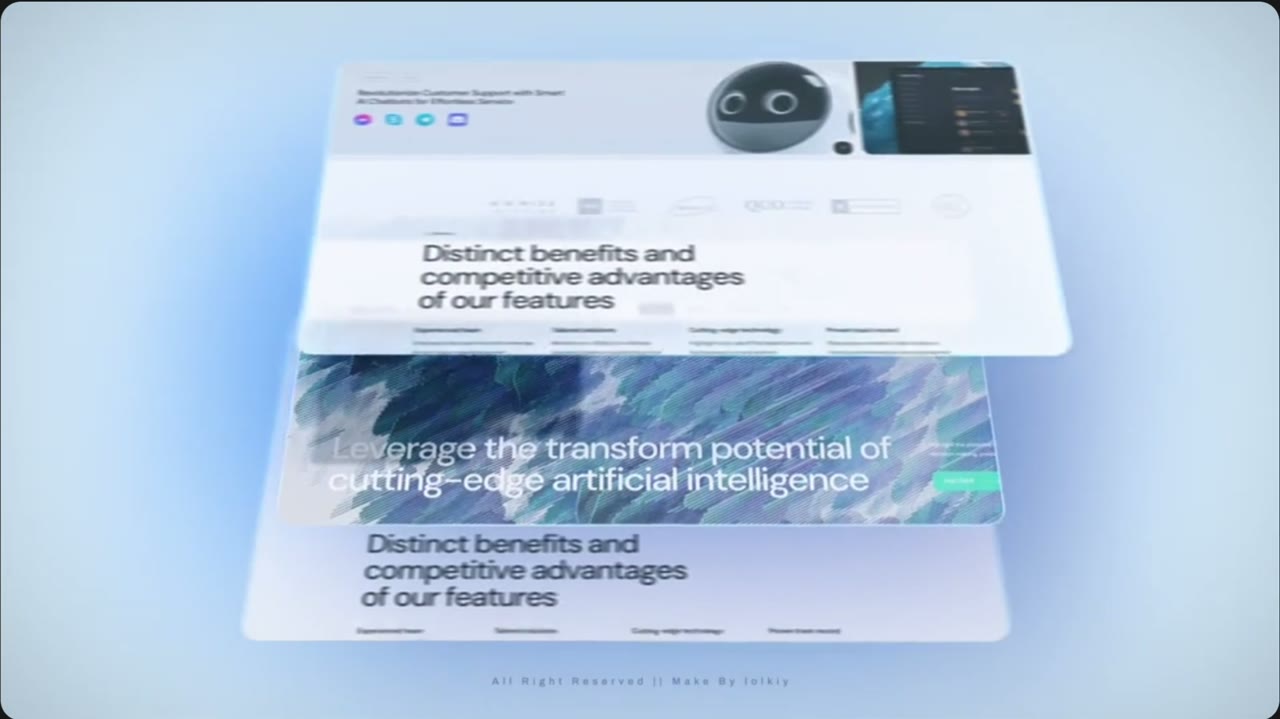 Scene 30:04–0:06Clinical Documentation
3D tilted page stack
- In the reference
- Three copies of a features page tilt in 3D and overlap (“Distinct benefits… of our features”).
- Motion
- Camera orbits left-to-right; pages fan apart in depth.
- Copy
- Eyebrow: Clinical Documentation
- Headline: Notes that keep pace.
- Four feature labels: Ambient capture · AI suggestions · Note quality · Finalize faster
- Show first
- The draft note editor (white version) as the top page, so viewers see the note being written first.
Product UI to make
Feature page · Note editor · 1920×1080
Script: Draft note editor with SOAP sections, a few readable sentences filled in (generic patient: “Patient reports reduced knee pain…”). Right rail: white AI Suggestions panel with thin orange border, two suggestions with Accept buttons.
Feature row · 4 icons · 1920×400
Script: Four small icon tiles in a row with the four labels above, navy icons, orange accent line.
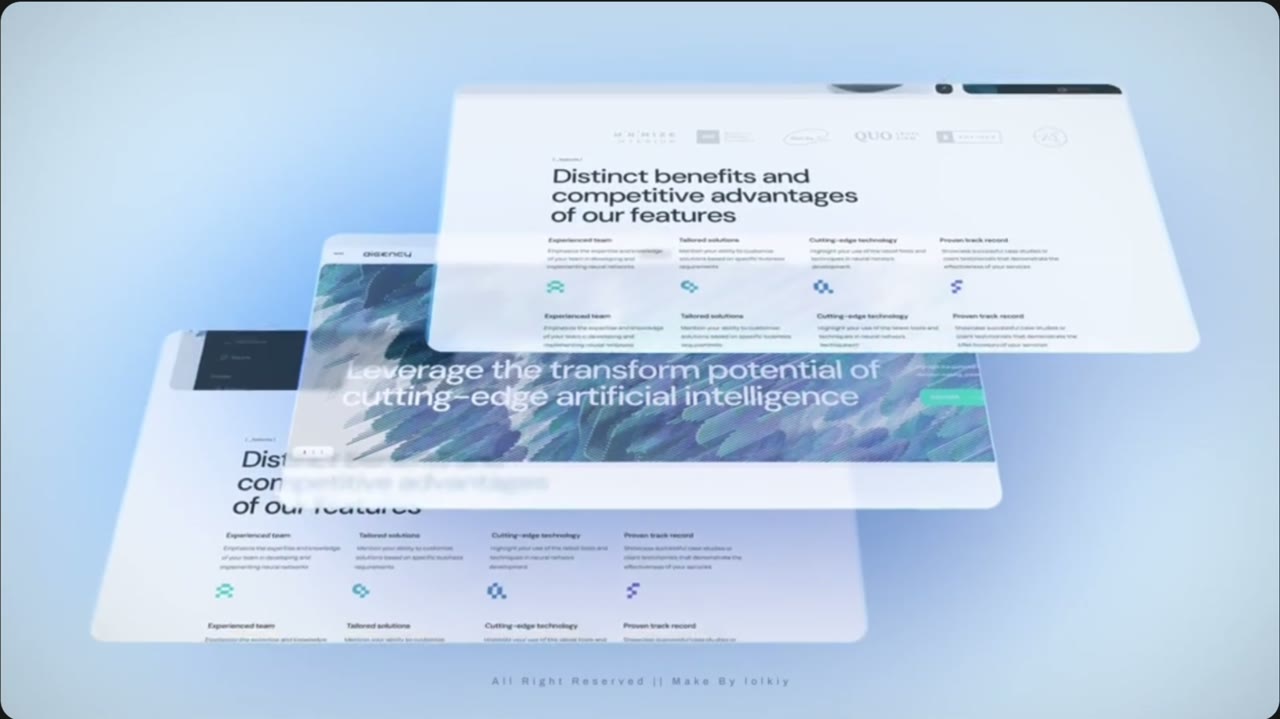 Scene 40:06–0:08Clinical Documentation
Stack pan continues
- In the reference
- Same stack, camera keeps drifting; the feature row with four icons comes forward.
- Motion
- Continuous pan, top page lifts toward camera.
- Copy
- Big stat: 17 min → 90 sec
- Sub-line: Time to complete a note.
- Show first
- AI Suggestions panel lifts forward, then the stat appears.
Product UI to make
Stat banner · 17 min → 90 sec · 1920×600
Script: Wide white banner, left: “17 min” struck through in navy/40, arrow, “90 sec” in large orange-to-yellow gradient. Right: the blue AI Suggestions component cropped tight.
 Scene 50:08–0:10Clinical Documentation
Big number feature
- In the reference
- Flat screen: “Experience AI voices…” with a big 150+ number and a flag grid; team photos peek below.
- Motion
- Slow vertical scroll down the page.
- Copy
- Headline: Finish the day's notes before you leave.
- Big number: 1.8 hrs
- Label: Reclaimed per clinician today
- Show first
- Daily documentation card (already in Product UI Creator → Summary Cards).
Product UI to make
Daily documentation card + note chips · 1920×1080
Script: Use the existing Daily documentation card on the right. Left: headline. Replace the flag grid with 14 small rounded chips reading “Note finalized ✓”, all orange checks.
 Scene 60:10–0:12Intelligent Scheduling
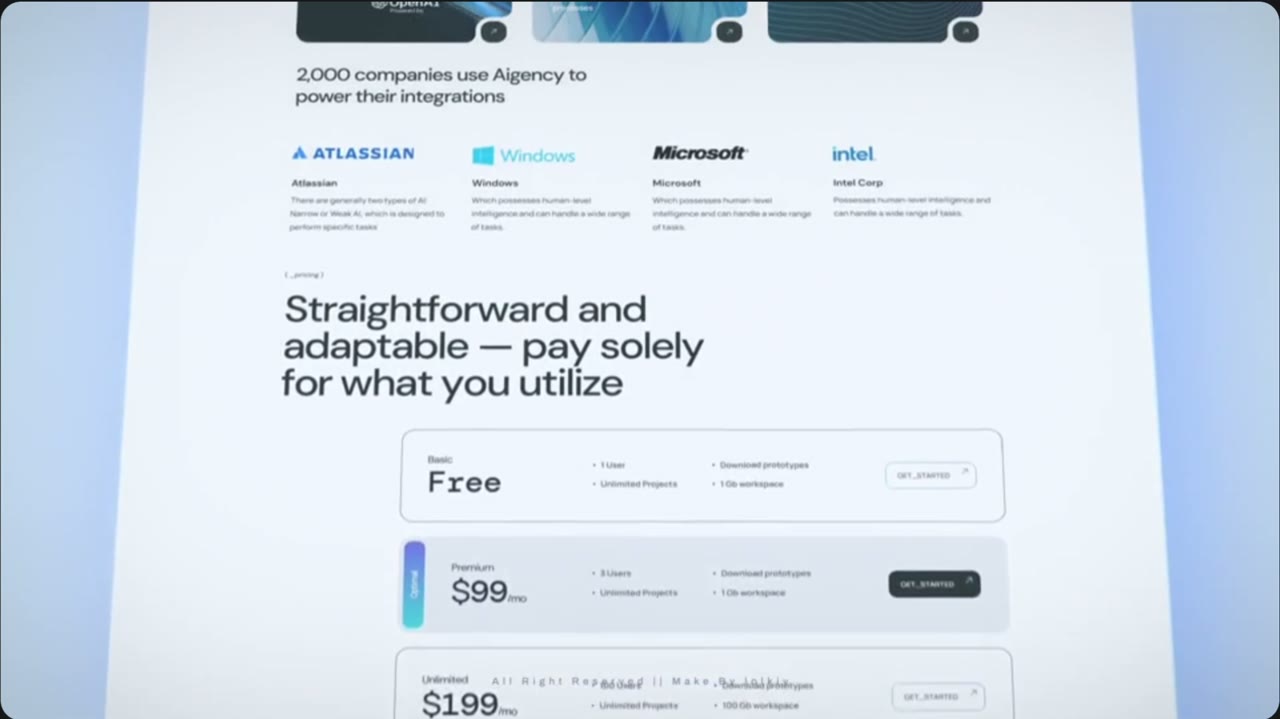
Pricing tiers card
- In the reference
- Three stacked tier rows (Free / $99 / $199) with “Straightforward and adaptable” headline.
- Motion
- Camera tilts back and scrolls up over the rows.
- Copy
- Eyebrow: Intelligent Scheduling
- Headline: Fill the gaps. Keep moving.
- Row labels: Opening found · Patient matched · Slot filled
- Show first
- Three schedule rows replacing the price tiers — no prices anywhere.
Product UI to make
Schedule rows · 3 states · 1920×1080
Script: Three stacked white rows, same shape as the tiers. Row 1: grey dashed slot “10:30 AM · Opening found”. Row 2 (highlighted with blue bar, like the $99 row): “Patient matched · Waitlist”, orange “Fill opening” button. Row 3: solid blue slot “Slot filled ✓”.
 Scene 70:12–0:14Intelligent Scheduling
Logo + integration scroll
- In the reference
- Integration cards and logos (“2,000 companies use…”) scroll past above the tiers.
- Motion
- Fast upward scroll with a soft tilt.
- Copy
- Line: Smarter schedules. Fewer no-shows.
- Stats: Provider utilization 92% · 5% revenue increase
- Show first
- Scheduling week grid scrolling, ending on the stats.
Product UI to make
Week grid + stat strip · 1920×1400 (tall, for scrolling)
Script: Use the existing scheduling week grid graphic on top; below it a strip with two stat blocks: “92%” Provider utilization and “5%” Revenue increase, numbers in navy, labels in navy/60.
 Scene 80:14–0:16Revenue Cycle Automation
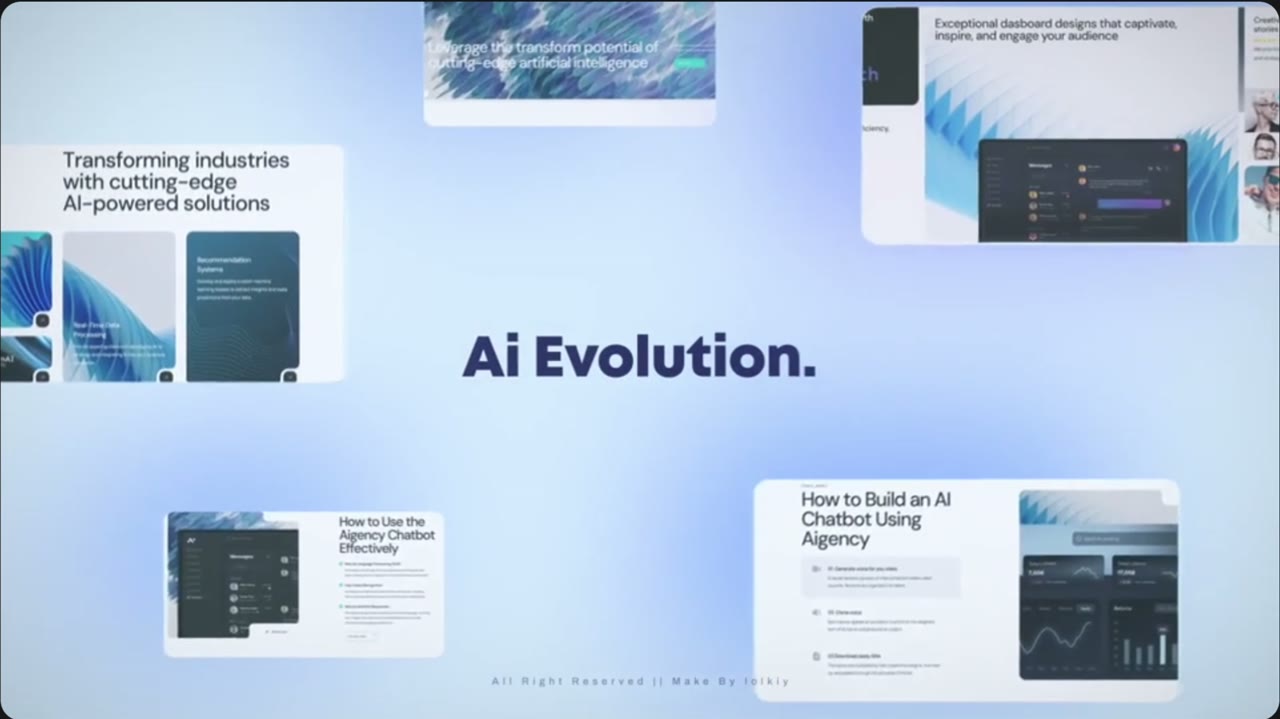
Card collage
- In the reference
- Big word mark in the middle; four small screens float around it at different depths.
- Motion
- Cards drift outward (parallax) while the title holds still.
- Copy
- Center title: Fewer denials. Faster finish.
- Card labels: Revenue Cycle Dashboard · Submitted → Paid · Payer call automated · 7.5% lower denial rates
- Show first
- Revenue Cycle Dashboard card top-left (largest), then claim steps.
Product UI to make
Collage card · Revenue dashboard · 900×600
Script: Existing Revenue Cycle ad panel, cropped.
Collage card · Claim steps · 700×500
Script: Four rows Submitted, Reviewed, Approved, Paid, each with an orange check and full yellow progress bar.
Collage card · Revenue voice agent · 700×500
Script: Existing revenue voice agent graphic: “Calling payer… claim status confirmed”.
Collage card · Denial stat · 600×400
Script: White card, big “7.5%” navy, label “Lower denial rates”.
 Scene 90:16–0:18Platform
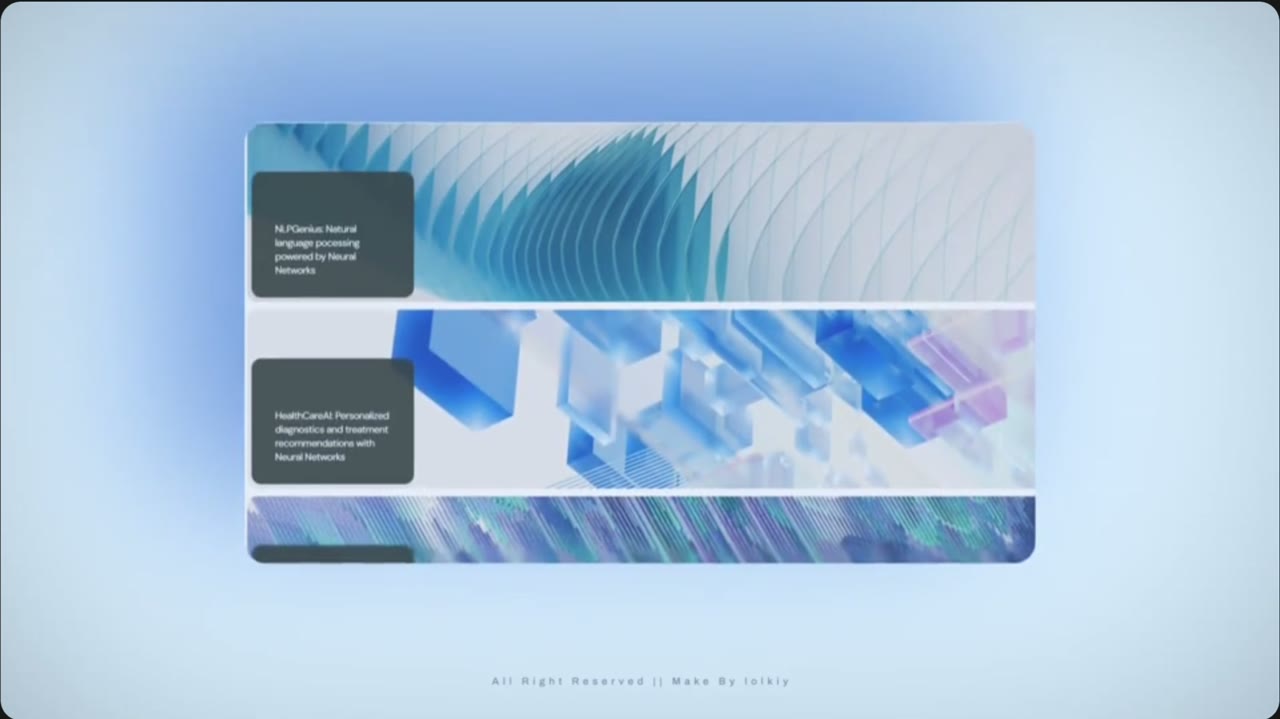
Image strip panel
- In the reference
- One wide panel with three stacked image bands, each with a dark label box.
- Motion
- Bands slide sideways in opposite directions.
- Copy
- Band 1 label: Clinical Documentation — Notes that keep pace.
- Band 2 label: Intelligent Scheduling — Fill the gaps.
- Band 3 label: Revenue Cycle Automation — Get paid faster.
- Show first
- Same product order: Documentation top, Scheduling middle, Revenue bottom.
Product UI to make
3 product bands · 1920×300 each (export 3)
Script: Each band: wide crop of that product's screen as the background, navy label box on the left with the label text in white.
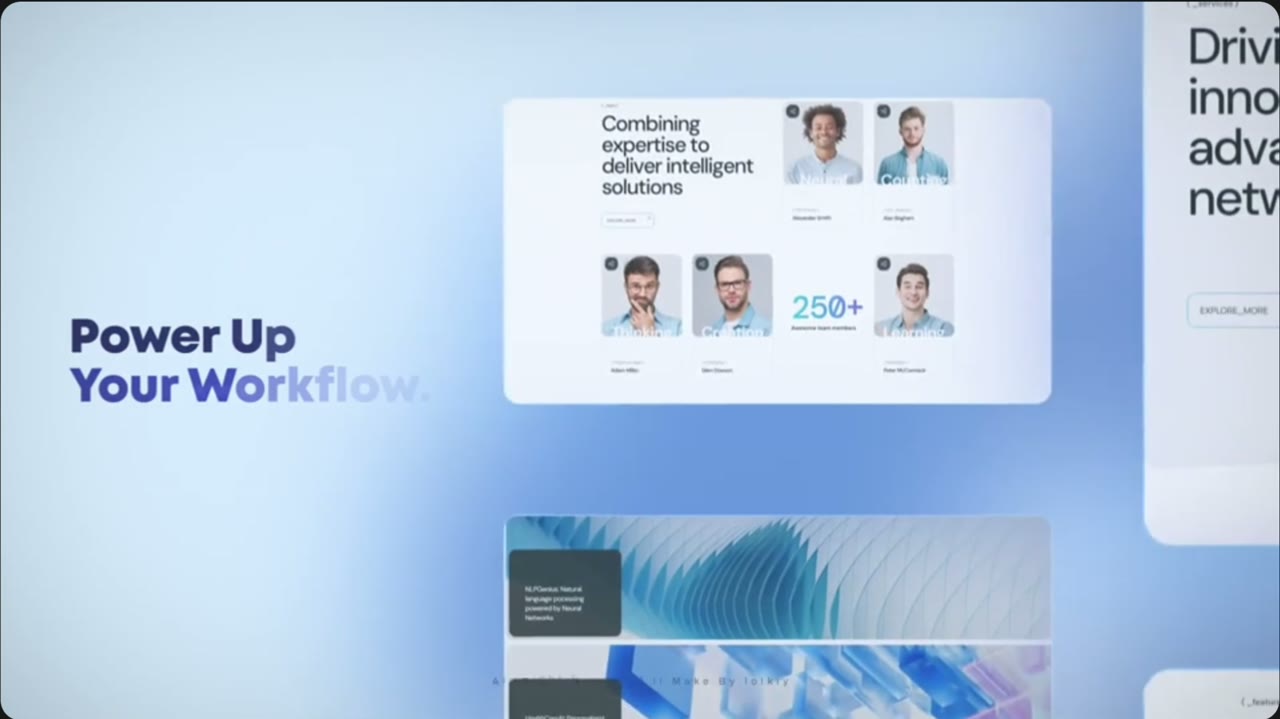 Scene 100:18–0:20Platform
Workflow headline
- In the reference
- Bold headline on the left; team-photo card on the right with a 250+ stat.
- Motion
- Camera slides right; card floats in from the edge.
- Copy
- Headline: See how your practice can run better.
- Card stat: Booth 506
- Card line: APTA Private Practice · Nov 11–14
- Show first
- Booth card with the T-shirt / booth team photo.
Product UI to make
Booth 506 card · 1200×800
Script: White card, two or three team photos (from the T-shirt press photo), big “506” in orange-to-yellow gradient, line beneath. Not a product screen — a photo card.
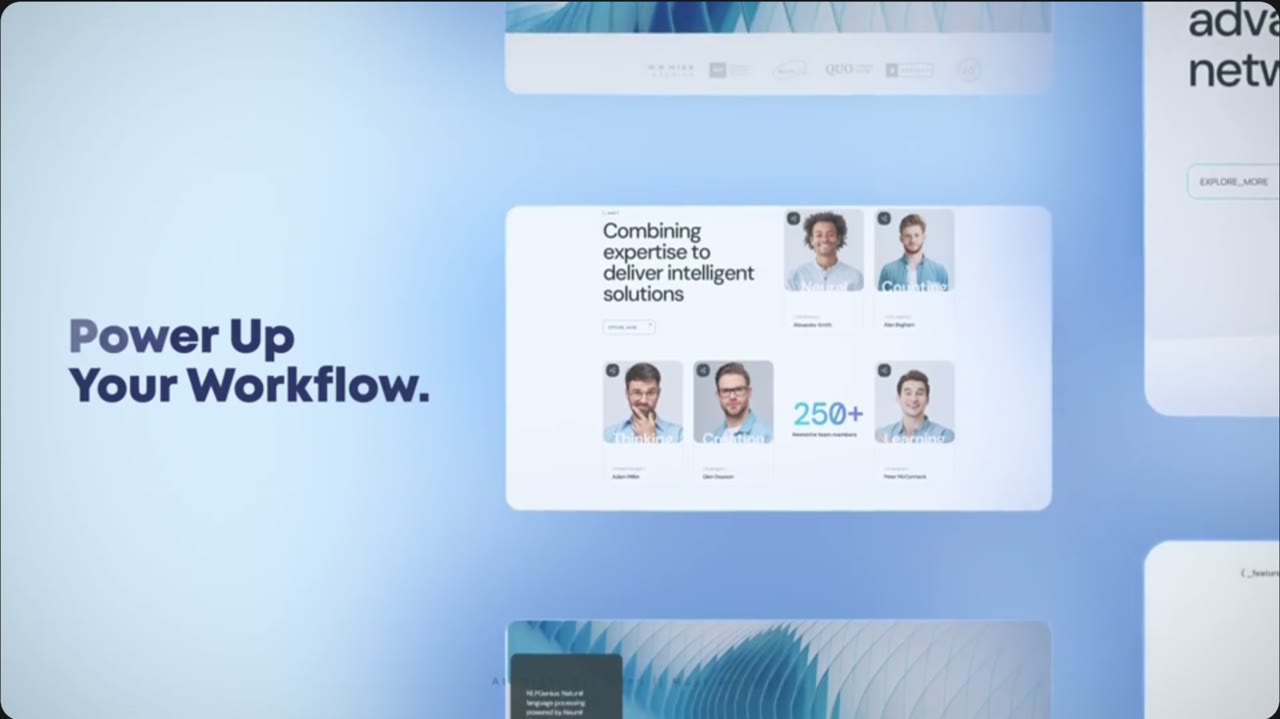 Scene 110:20–0:22Transition
Blur whip transition
- In the reference
- Everything streaks and blurs into a light frame.
- Motion
- Fast motion-blur zoom out.
- Copy
- No copy.
- Show first
- Nothing new — tint the blur navy to orange.
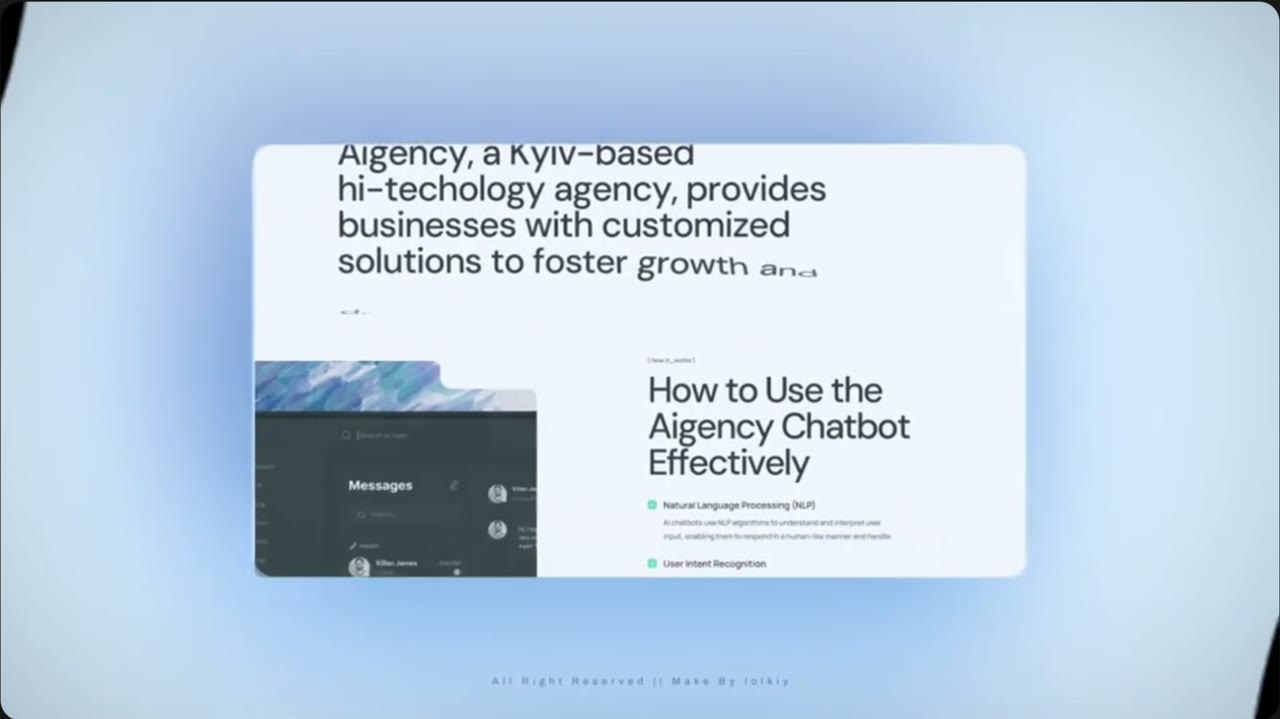 Scene 120:22–0:24Transition
Star burst reveal
- In the reference
- Four-point white star spins and grows over a blue gradient, wiping the screen.
- Motion
- Star rotates and scales to fill frame.
- Copy
- No copy.
- Show first
- Raintree sparkle icon instead of the star; background #000080 to deep navy.
Product UI to make
Sparkle icon · 1000×1000 transparent
Script: White four-point sparkle (same as the Clinical Documentation header icon), transparent background.
 Scene 130:24–0:31Outro
Logo end card
- In the reference
- Star icon + “SaaS Product” on a blue gradient; then the video loops.
- Motion
- Hold, slight glow; fade out.
- Copy
- Logo: Raintree
- Line: Runs on Innovation.
- Sub-line: Meet us at Booth 506 · APTA Private Practice · Nov 11–14
- Show first
- Logo only — no product screens.
Product UI to make
End card · 1920×1080
Script: Navy background, white Raintree logo, sparkle beside it, line in white, “Booth 506.” in orange-to-yellow gradient.